renv::restore()PopAgingDataViz—UK
PRE-WORKSHOP SESSION

The Fundamentals
PopAgingDataViz—UK is an upcoming workshop on visualising population data within ’s graphical ecosystem. Ergo, you will need installed locally on your machine before we congregate at the University of Oxford.
Participants will be asked to run their scripts using RStudio,1 a powerful, open-source integrated development environment (IDE) optimised for . If you do not already have RStudio installed on your machine, you can download the application by clicking here.
The workshop will also serve as a rudimentary and high-level introduction to git and versioning. Consequently, participants are strongly encouraged to “get git”:
Now, how will you link git to and RStudio? This is one of the exercises you are expected to complete ahead of the next pre-workshop session in August—a point I will return to later.
The Course Website
All course materials will be hosted on a dedicated website. The website is not yet “live”, but will bear a strong resemblance to the sites accompanying previous iterations of PopAgingDataViz. If you’d like a preview, make sure to hit the button below.
Coding Practice
PopAgingDataViz—UK will be a short course on visualising tabular and geospatial data—not coding, pre-processing, or wrangling data per se. However, these skills obviously go hand-in-hand. With this in mind, I highly encourage those of you who are new to programming to do some light work within RStudio ahead of the workshop.
To this end, check out Andrew Heiss’ brilliant adaptation of Primers, which you can access by clicking the button below.
Click to Expand or Close Primers
There are, as you likely know, a universe of possibilities when it comes to coding within : different libraries, functions, workflows and so on. Much of PopAgingDataViz—UK will draw on the tidyverse—a wonderful family of packages and corresponding functions. You can learn more about the tidyverse by perusing R for Data Science.
Packages
All the libraries necessary for PopAgingDataViz—UK can—as of late-July 2025—be accessed through one of two channels:
The recommended approach involves (1) cloning a GitHub repository; and (2) using renv to ensure that all required packages are available to you locally in a stable state.
How can you go about doing this? First, click here and clone the linked repository. If you’re new to “cloning”, fear not—the video below offers a streamlined overview of how to clone repositories via RStudio (i.e., without using the command line!):
This video assumes that you’ve successfully installed git on your machine.
Next, you’ll want to:
Open
workshop_packages.R, which is housed within the folder you just cloned.Make sure you run line 13 (see below) to install the relevant packages:
That’s it!
The easiest way to ensure that all PopAgingDataViz—UK libraries are locally available is to download—and then execute–the script file embedded below.
Why go the “tricky” route? As we’ll discuss in August, renv provides significant utility by creating a reproducible, isolated environment that captures the exact package versions used to clean, pre-process, and derive statistical outputs or graphics.
Fonts
During the workshop, I will encourage you to use custom fonts to beautify your visualisations. In the spirit of simplicity, we will only use two freely available Google Fonts to “touch-up” our default graphics. These fonts can be downloaded below:
API Keys
Valid API keys will be required to pull data from two libraries that we will deploy to visualise geospatial data: (1) tidycensus and (2) cancensus.
The Challenge
In previous years, PopAgingDataViz culminated with a friendly “Shark Tank” competition. What in the world does that mean? Click here for a broad overview.
This go-around, we’ve opted to eschew the competitive framing and invite all of you to participate in a low-stakes challenge. We’re still in the process of determining what this will entail substantively—what shape it will take, what parameters will define it, what expectations it will carry, inter alia. What we can say is that this challenge2 will ask you to concretely apply the skills and techniques you acquire throughout PopAgingDataViz—UK. Group work will be encouraged. Data—and incentives—will be provided.
Although the exact specifications of the challenge have not defined, participants will—in all likelihood—be encouraged to work with data from the American General Social Survey (GSS) or statistics drawn via nomis, a “service” offered by the United Kingdom’s Office for National Statistics (ONS).
Some Orienting Exercises
Before we all reconvene on the 13th of August, please complete the following exercises to the best of your ability.
Download and
RStudio.Link
gitto yourRStudio. You may want to play around withusethis, too.Install all the libraries needed for PopAgingDataViz—UK (as of late-July 2025)—ideally using GitHub and
renv.Install the fonts embedded above.
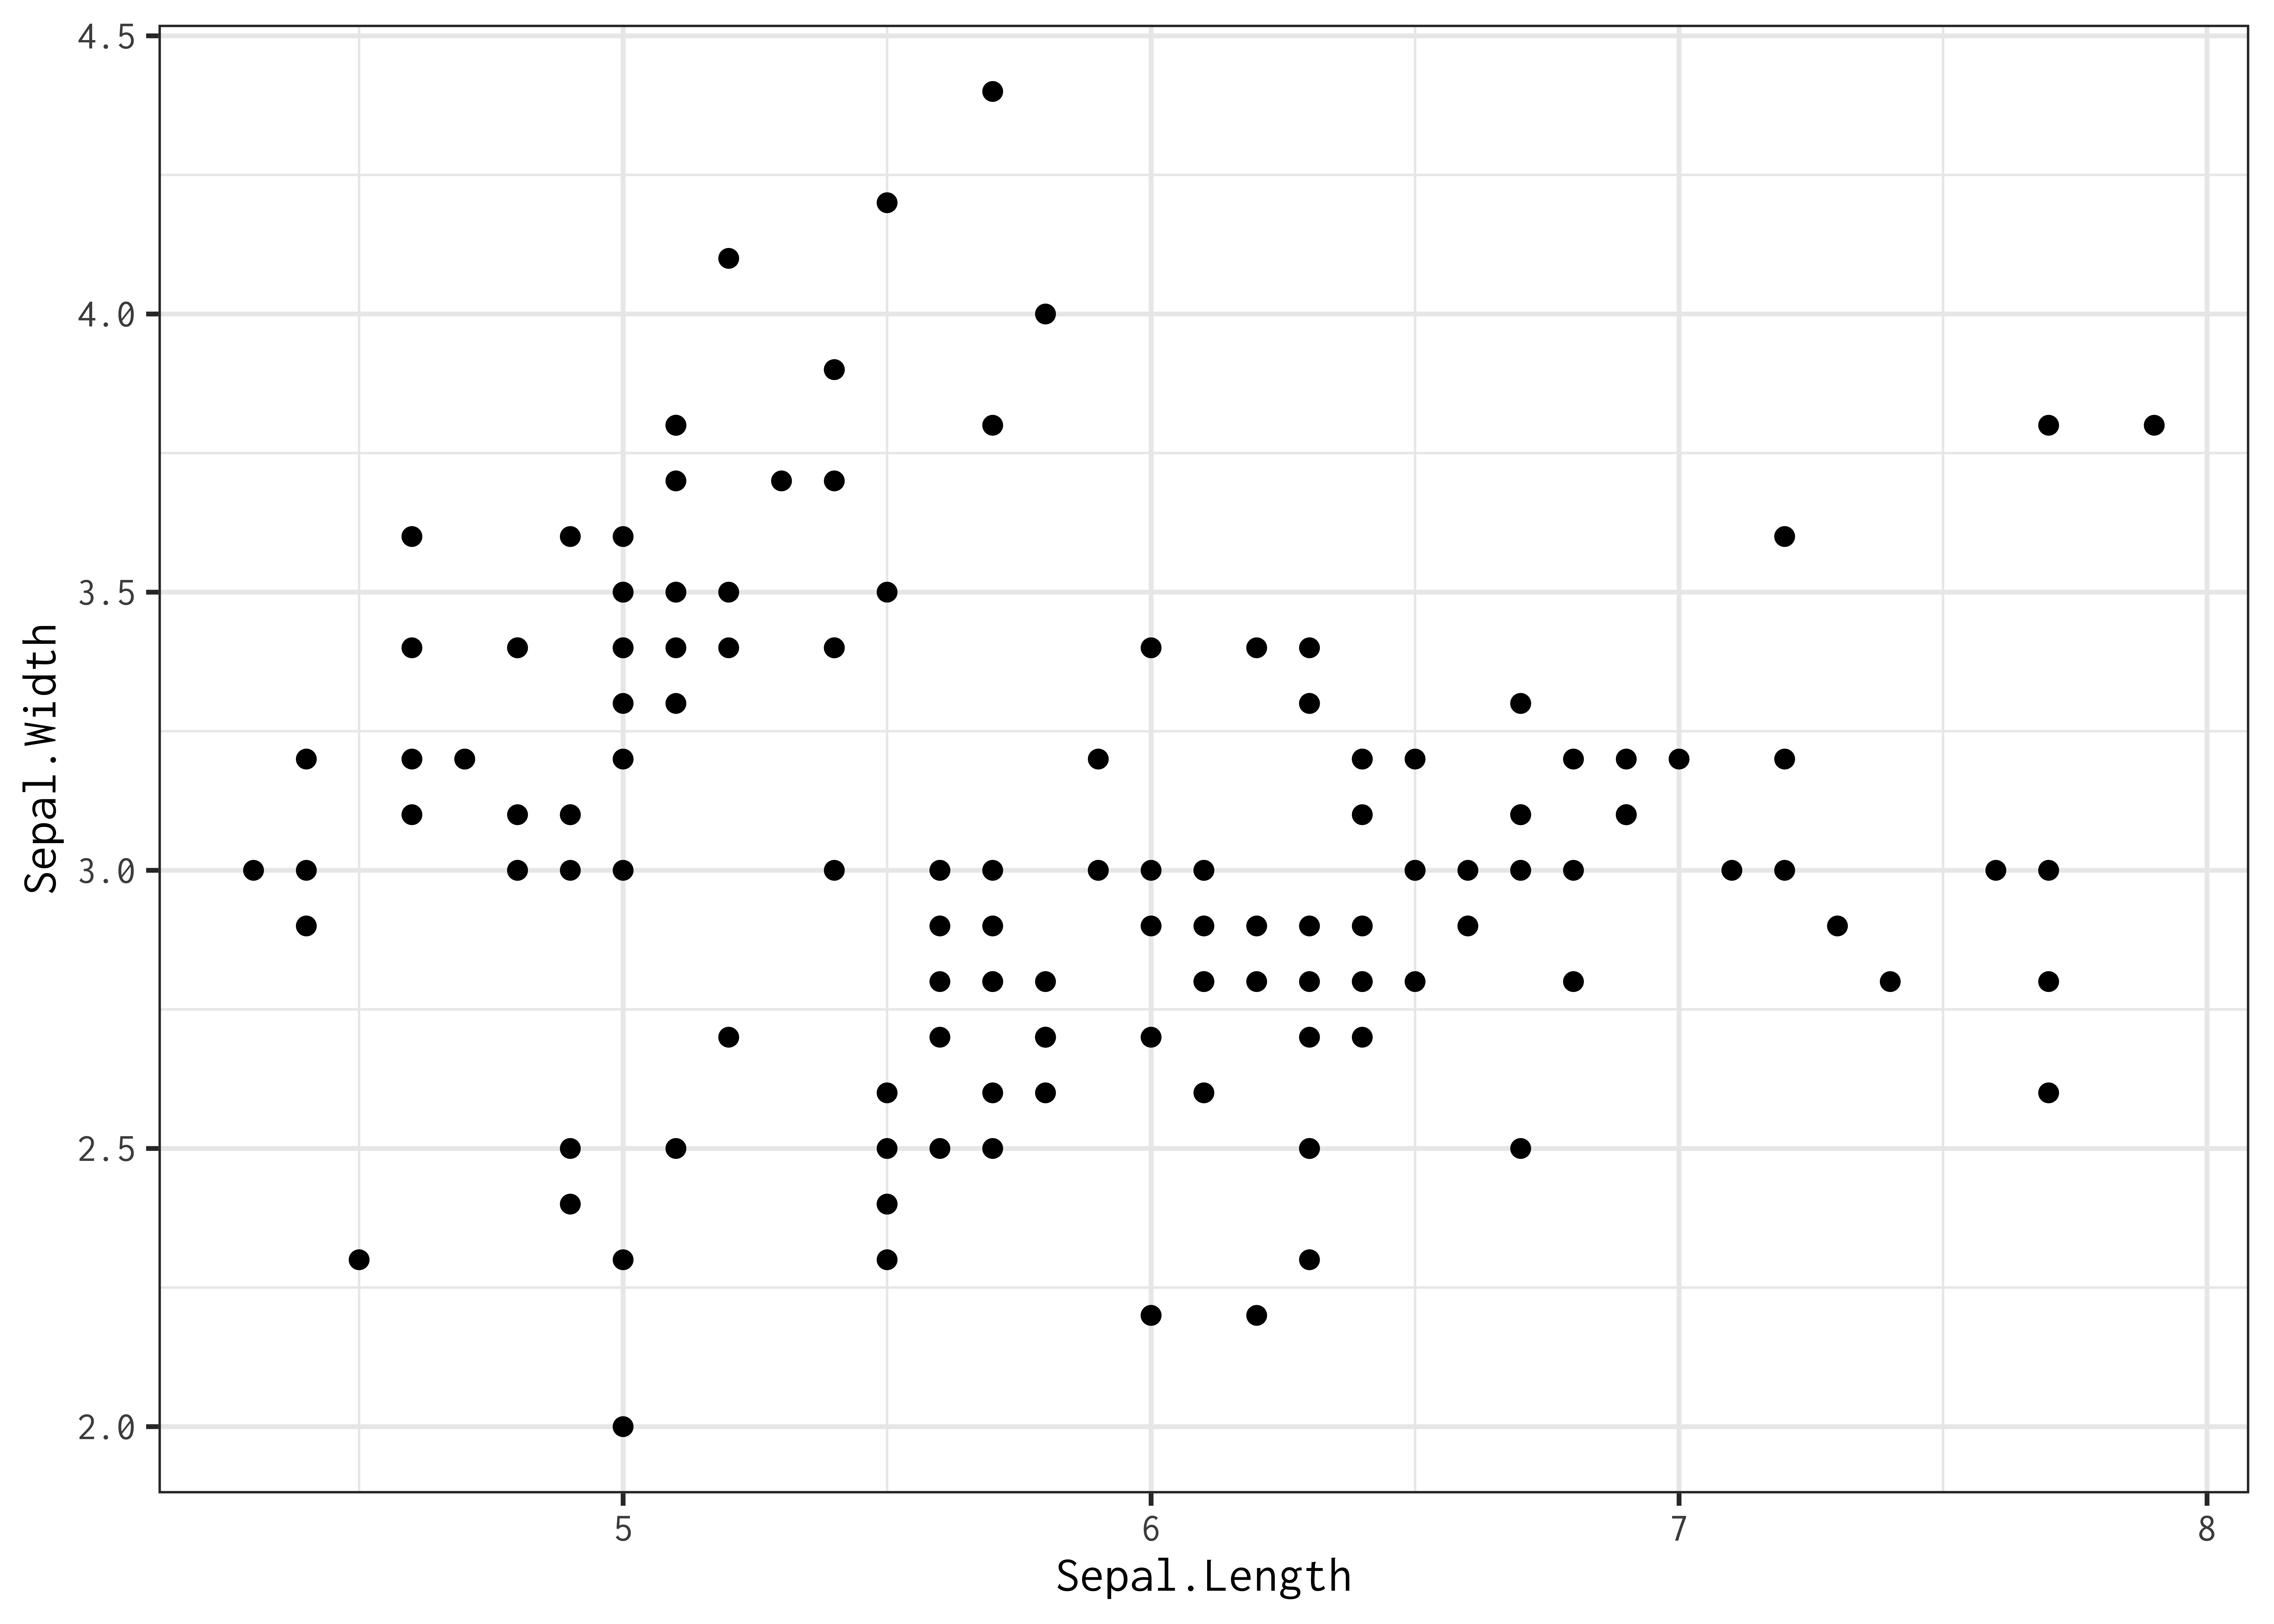
Ensure that you can produce this simple plot in (hit the button below):
Click to View—and Close—Code and Plot
library(tidyverse)

iris |> ggplot(mapping = aes(x = Sepal.Length,
                             y = Sepal.Width)) +
        geom_point() +
        theme_bw(base_family = "Inconsolata")
Ensure that
workshop_packages.R3 runs without any issues.Acquire API keys to pull data from
CensusMapperand the US Census Bureau—and install them by following the relevant hyperlinks.
Footnotes
Participants should, of course, feel free to use other IDEs (e.g.,
Positron), environments, or source-code editors to run the material featured in the upcoming short course.↩︎Not to be confused with MTV’s The Challenge, an underrated reality television programme.↩︎
If you managed to successfully clone the companion repository, this file should be available in your
scriptfolder. Otherwise, you can directly downloadworkshop_packages.Rusing the second “channel” or strategy detailed above.↩︎